In 10.4, we have a completely new debugger for C++Builder for Windows 64-bit, with greatly improved inspection of the contents of STL and other types, as well as stability.
A New Debugger
Before digging into the details, here is what we’ve included in 10.4: a new debugger for C++ Win64 based on modern LLDB and with support for evaluating complex STL and other types. This support for complex types is also fully extensible if you struggle with your own complex data structures. This is a huge improvement for your productivity, both in terms of debugger stability and in terms of the data available to you when debugging.
Historical Debugging C++ on Windows
Depending on the language your application is built with and platform and bitness your app targets, RAD Studio uses one of several different debuggers and file formats for debug information. One platform that has needed particular attention is Win64 for C++, for two reasons: debugger technology, and side-effects of the Clang compiler.
Issues
Before 10.4, C++ on Win64 used the DWARF v2 debug format, and a custom debugger.
While we don’t normally focus on problems in blog posts, historically this debugger was not without issues. Some customers may have experienced ‘disconnected session’ errors, which effectively indicates an error or crash in the debugger (sometimes in the application itself, which the debugger was unable to handle.) Sometimes, the IDE appeared to freeze for some time, which was actually the IDE waiting for the debugger to time out.
Inspecting or evaluating complex types
In addition, mostly due to optimisations even in debug mode, it’s been difficult to inspect the contents of structures like STL types. Calling methods, like c_str() to evaluate a string, might not evaluate if the method was not linked in, and therefore not available to the debugger. For more other types, like std::vector or std::map, sometimes the accessor methods were inlined, or if not used not linked in, and in both cases not available as a callable method to the debugger either.
This made it difficult to see the container elements in tooltips, Local Variables, Evaluate/Modify, Watches, and so forth. The end result was that data was not always easy to evaluate or visualise.
These problems were not unique to C++Builder: other IDEs have struggled with it as well. It’s been a common C++ problem.
In 10.4, we have addressed both of these issues by introducing a new debugger for C++. The debugger is based on a modern version of LLDB, uses a recent debug format, is stable, and handles complex types specifically including common STL types, and is fully extensible.
The new C++ Debugger
First up, the technical info. In 10.4, C++Builder uses a customised version of LLDB v9 for Windows 64-bit debugging. To my knowledge, we are the first vendor supporting LLDB for Windows – while common and the de-facto standard on other platforms, it has not been on Windows yet. (We were also the first to ship and support Clang for Windows, with Clang 3.1 with C++Builder XE3 in 2012.)
We pair LLDB with DWARF v4, using v4 instead of v5 for various technical reasons to do with the Clang compiler. This provides improvements in the debug information available – i.e. what can be “seen” and debugged.
In terms of stability, we aim that LLDB is significantly more stable than the previous debugger used for Win64. The most common causes of instability in the old debugger, which we investigated and are known, are not present in the new debugger. In addition, we’ve also improved the IDE’s interaction with the debugger, including showing more informative error messages.
Debugging Complex Types
So far so good – new debugger, modern, stable. The most exciting feature though is improved debugging with support for STL and other complex types. Using C++Builder 10.4, you will be able to easily evaluate and see the contents of your vectors, maps, strings and more.
To recap, there are a couple of reasons inspecting or evaluating complex types can be difficult for C++, for all C++ toolchains. One is that the data structures are complicated: it is not trivial to find an element in a std::map, and even in a string the data can be in two different places. That means it is not easy to manually locate data. Another is that the methods used to access elements need to be accessible to the debugger. A method that is never called will be optimised out; a method that is called may be inlined, even in a debug build, given the header-only nature of the STL. A method that is not linked in or is inlined is not callable (it doesn’t exist as a separate, standalone method) and so the debugger can’t use it. The end result is that it is not always possible for a debugger to evaluate the contents of a string, or the nth element of a vector, because the understanding of the data layout or the methods that wrap that data are not there.
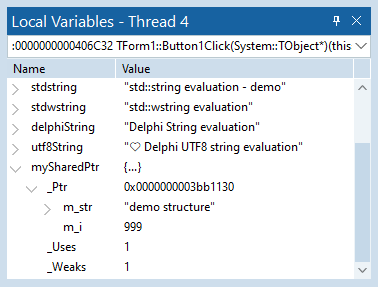
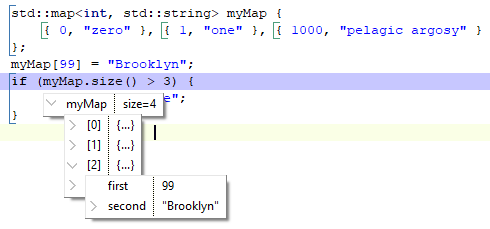
C++Builder 10.4 uses LLDB formatters to solve this problem. For a complex data type, there is a small Python script which understands the data structure. The debugger invokes this, and it is this script which returns data to be shown in the tooltip, Watches, Evaluate/Modify, Inspect, and Local Variables views.
 |
 |
In these images, you can see 10.4’s Win64 C++ debugger showing the contents of several different string types (STL narrow and wide strings, Unicode strings, a Delphi UTF8 string); a shared_ptr showing both the contents of the pointed-to item and the refcount, included weak references; and the contents of a std::map, one of the most complex STL containers.
The full list of formatters we have included in 10.4 is:
- std::string
- std::wstring
- std::vector
- std::deque
- std::map
- std::shared_ptr
- AnsiString types including UTF8String
- String/UnicodeString
- WideString
These types are the most commonly used STL containers, plus the STL string types, all which are extremely common and could have problems evaluating in the past; plus a smart pointer for which more information than just the pointed-to object is useful; plus Delphi string types. Ie, this is a high-value set of types that might need visualisation. (Not all types do – an average struct or class is fine, and the majority of types benefit from the improved debug format and debugger without requiring a formatter. Formatters are useful for complex types where understanding of memory layout or debug methods can be required.)
You can write these scripts yourself too. If your app has complex data types, and you have trouble evaluating them, you can write a short script to present the data inside your data type any way you want. The debugger is fully extensible.
Overall
C++Builder 10.4 introduces a new debugger for Win64. Based on a recent version of LLDB, it’s stable and modern. It also features formatters allowing evaluation of complex types including key STL data types. Our goal is to make the debugging experience in 10.4 much more stable and powerful, and greatly more productive by making debugging data work fluidly and present what you want onscreen.
We’re really excited by this feature and we can’t wait for you to try C++Builder 10.4 Sydney!
Learn more about C++Builder 10.4 Sydney at our website and download your 30 day free trial today!
Update 27 May 2020
Please install Patch 1 for RAD Studio. There is a missing file in the 10.4 installation, and you need that file in order for the debugger to work correctly with the formatters. (Without it, you’ll see STL collections shown with their fields, not able to see their items, and strings will often show as character arrays.) Instructions for installing Patch 1 are here.
