The word “triage” for me brings up images from MASH re-runs; or memories of emergency room visits with nurses quickly deciding whether you are healthy  enough to sit and suffer in the lobby for a few hours.
For years, triage in the database performance world meant a simple listing of the instances with critical alerts and a quick way to decide which problems were the worst on a given instance. Most database performance tool vendors told the same story of years, of detecting problems before end users were affected (preferably.)
But the world changed gradually as DBAs were challenged to “do more with less” and the ratio of systems monitored to DBAs to resolve issues rose. With DBAs sometimes responsible for monitoring hundreds of instances, the problem is no longer about highlighting critical alerts or even diagnosing a single instance rapidly. Now the problem is about rapidly assessing the relative health of all monitored instances and quickly figuring out which instance should be tackled first.
One good way to perform this triage task is to sort all instances based on a single score, a health index, that gives an indication of the relative health of that instance to other instances monitored.
What is the purpose?
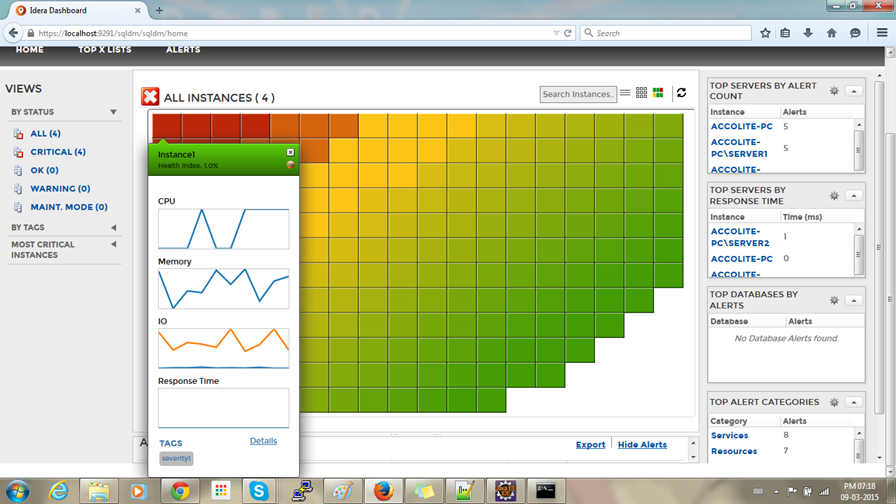
The challenge is to represent hundreds of instances in a single screen while making it possible to visualize relative health. The health index values range from 0 to 100 with 100 being the best score. The DBA can visualize the relative health based on the shaded spectrum of colors, always sorted to place the worst instance in the top left corner.
The instance boxes are all the same size so the same display can be used to assess the overall health of all instances as well as the relative health between instances. Heatmaps that use size to indicate poor health can be misleading to overall status of all instances as the majority of the environment gets reduced to a small blip.
What does the health index mean?
The Diagnostic Manager health index is calculated with a score and adjusted or normalized as needed to represent relative health among monitored instances. The default formula is 6 * Critical Alerts + 3* Warning Alerts + 1 * Informational Alerts. This raw score is then normalized as needed so that the best instances have a score of 100% health.
Idera will be providing access to the relative factors for customers who want to tweak the formula based on their preferences.
Time to diagnose
Did you notice the little Diagnostic Manager icon in the summary instance view? That little icon launches the DM Console in context to the instance identified. And you are on your way to working through your triage queue one instance at a time!