One of the frequent questions I get about SQL Diagnostic Manager pertains to one of the most fundamental features of the product – exactly how is server downtime detected? This is usually answered with relatively straightforward explanations about running test queries and timeouts, but some of that masks a more complex underpinning. Here I would like to explain some of the intricacies of server availability alerting in SQLdm – perhaps the 400 level version of what is usually expressed at a 200 level. Even so, in some places I will simplify some terminology or bypass some specialized checks for the sake of clarity and brevity – this is not intended to be a full code walkthrough.
I want to caveat that it is not necessary to understand this in order to use SQL Diagnostic Manager: indeed, very few people outside the development group have reason to need this information. It may, however, be interesting or enlightening to longtime users.
Server availability in SQL Diagnostic Manager is verified by both explicit and implicit checks. The explicit checks are somewhat self explanatory – the server is periodically polled to see if it is online. The implicit checks are also not difficult to understand – in the course of collecting other information from the server, the availability of that server is assumed, and if it changes, that information is available to be alerted upon. To understand why the two kinds of checks can behave differently at alert time, it’s necessary to understand some of the architecture of how they work.
Explicit Checks – The Server Ping

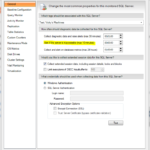
Let’s begin by discussing the explicit checks. In the Server Properties dialog there is an option “Alert if the server is inaccessible” which is set by default to 30 seconds. Internally this setting, and the process by which it is checked, is called the “Server Ping.” This is a lightweight check of the server that is designed such that it can be decreased in interval down to single-digit intervals in seconds without causing undue strain on the monitored server. Programmatically what happens is that two threads are started. The first thread is a call to “select 1″ from the master database of the monitored server. It is called asynchronously. The second thread is a timer set to the configured server ping value – again, by default 30 seconds. Both are spun up at the same time and then it is a race to the finish.
- Connection check thread
- Call “select 1″ against the master database with a timeout equal to the server ping configuration value
- Server Online: Return success, stop timer thread
- Server Offline: Try again, once, promptly. This prevents alerting on truly transient errors. If error persists, raise an alert, and stop timer thread.
- Call “select 1″ against the master database with a timeout equal to the server ping configuration value
- Timer thread
- Sleep for a time equal to the server ping configuration value
- Server Online: If the server is responsive, the timer will be stopped and deleted before finishing its sleep
- Server Offline: If the sleep time fully elapses, stop the connection check thread and raise an alert
- Sleep for a time equal to the server ping configuration value
The upshot of this is that the definition of “online” or “available” in this check is tightly coupled to the frequency of the check. A server that is checked every 30 seconds, but which takes 45 seconds to respond, will persistently show as unavailable. This is by design and at the request of many users. If you have ever tried to connect to a poorly responding server in Management Studio and rolled your eyes as a minute or more elapsed before failure, you know the feeling of “knowing” that a server is down before being told. Therefore this server ping value should be set to what you’d consider the maximum acceptable time you’d expect a “select 1″ to take before the server is, for all intents and purposes, not accessible. In some environments this will be under 10 seconds while others might be comfortable with a minute or longer.
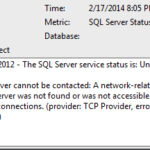
The only alerts raised by the server ping collector are Unable to Connect alerts. When the timer thread is kicking in and giving up on a connection that is taking a long time to establish, the error message shown in the alert is “Monitored server cannot be contacted: Timeout expired attempting to open server connection.” If, however, an error was encountered by the connection thread, you will receive “Monitored server cannot be contacted: ” followed by the message returned by the SQL Server. For example, I receive the following when I attempt to connect to a server on our QA domain from my laptop when I am not on the VPN: “Monitored server cannot be contacted: A network-related or instance-specific error occurred while establishing a connection to SQL Server. The server was not found or was not accessible. Verify that the instance name is correct and that SQL Server is configured to allow remote connections. (provider: TCP Provider, error: 0 – No connection could be made because the target machine actively refused it.)”
Implicit Checks – The Scheduled Refresh
SQL Diagnostic Manager collects many hundreds of counters over the course of the scheduled refresh, and many hundreds more in the course of on-demand monitoring. Before going on to describe the way this works internally, I should point out that by design, SQL Diagnostic Manager will only raise formal alerts (with their associated alert actions and responses, such as email notification) based on issues identified during one of its scheduled checks. Any errors encountered in the course of loading an on-demand view are displayed in-console at the time of the error but no further action is taken. (If you’d like more explanation of this process, please let me know in the comments or open a new thread in the forums.)
There are a number of different scheduled data collections in SQL Diagnostic Manager, the details of which are not important to this discussion. One of them, the aforementioned Server Ping, exists only for the purpose of checking availability. All of the other collectors are intended to get the many other pieces of data about performance, capacity, and activity on the server. Internally, a scheduled logical grouping of different round-trips to the server is called a probe, with each round trip called a collector. For example, a basic (and entirely contrived) probe might consist of a collector to get a list of databases followed by a second collector which would get the list of tables from any databases that start with the letter “A.” Every probe in SQL Diagnostic manager begins with a few basic collectors, none of which can be bypassed. Those collectors include checks for the monitored server version and edition, the current time on the server, and the number of outstanding connections SQL Diagnostic Manager already has open to the server. These are necessary for various reasons – the version and edition are used to ensure that the correct TSQL syntax is used in the course of the probe, the server time is used in the course of calculating counter values, and the number of simultaneous connections is used to prevent overload of the server in certain edge cases (if you’d like to hear about these cases, let me know).
Running these and other pre-process checks in each probe is primarily necessary for the internal workings of SQL Diagnostic Manager, but as the first checks in any scheduled activity, these serve a dual purpose as implicit connectivity checks. Therefore, it’s often the check to the server version and the server time which first encounter any availability issues, ultimately triggering an Unable To Connect alert.
Unable To Connect vs Unable To Monitor

Here is where it becomes a little more complex. If a probe successfully makes it through all of the pre-processing collectors (server version, server time, etc), the server is at that time assumed to be online. If the probe cannot make it through these checks, it is assumed to be offline and an Unable To Connect alert is raised.
If, however, an error is encountered in a subsequent batch, the server is NOT automatically assumed to be offline. As a basic example, if a batch to return a list of databases takes too long to return and a timeout elapses, it does not mean the server is offline. It would, however, mean that any subsequent collector which was going to use that list to take action on all databases starting with the letter “A” would be unable to run. Each collector logically builds on the results of the previous collector, and though retry logic is sprinkled liberally within the code, there are situations where the service will back away and declare that a set of counters was not able to be gathered successfully. If that back-off occurs AFTER the first implicit connectivity checks, the server status will be set to Unable To Monitor. This is distinct from Unable To Connect and it represents the fact that data could not be gathered and/or saved for a server.
Unable To Connect and Unable To Monitor are frequently confused and used interchangeably because they are both, by default, critical thresholds in the SQL Server Status alert configuration. Unable To Connect is critical for obvious reasons. Unable To Monitor is critical because the situation may indeed be critical – for example, the error preventing collection could be a stack dump or other serious error – and because in many environments the loss of the historical information gathered by SQL Diagnostic Manager is worth immediate investigation. If this is not the case, you might want to consider changing the severity of the alert configuration in your environment.
TIP 2: Unable To Monitor should be a transient state, encountered infrequently. It would be a state that might arise during a dirty cluster failover or other such rare event. If you are seeing it persistently, it is something to be reported to Idera Support.
Conclusion
SQL Diagnostic Manager has been designed such that users should not need to worry about the intricacies of connection retries, the difference among various timeout values, and all of the other strange minutiae that go into checking to see if a server is online. I have presented this information for those who are curious.
The most fundamental advice I can give to someone who is experiencing connectivity alerts is to check the error message in the alert itself. Knowing the difference between Unable To Connect and Unable To Monitor can help you to better interpret the error, and if you’re receiving them frequently, it will help clarify whether you’re dealing with an awkward configuration (as in Tip 1 above) or experiencing a bug (as in Tip 2 above).
So that is the long story of server availability checking in SQL Diagnostic Manager.