SQL Diagnostic Manager 10.5 will be available soon and it is currently available for our beta customers at https://community.idera.com/database-tools/database-management/beta
What’s New in Diagnostic Manager 10.5?
The focus of SQL Diagnostic Manager 10.5 is improving usability of SQL Diagnostic Manager as well as extending support for database-as-a-service deployments in cloud environments.
- Cloud Database Dashboard – New dashboards for DBaaS instances (Azure SQL, Amazon RDS) using current collections. Only panels and selections relevant to DBaaS currently supported metrics are displayed.
- Prescriptive Analytics Update – User interface simplification for more intuitive workflow. An updated recommendation engine incorporates more recommendations into DM and adds Cloud DBaaS recommendations.
- Alert Optimizations – Reduce false positive notifications and improve on-boarding user experience.
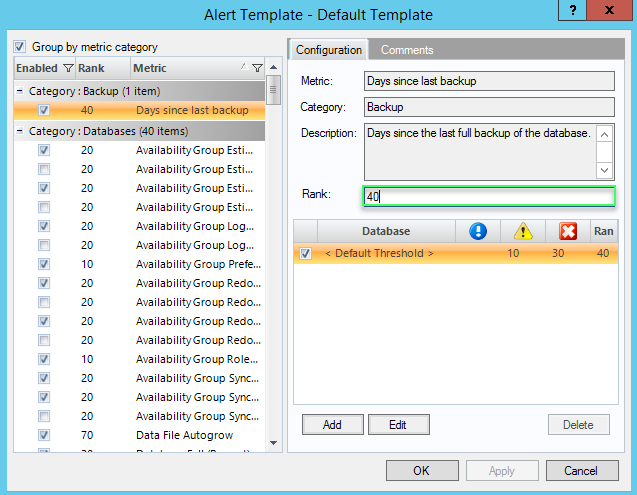
- Revised Templates – Three optional templates with expert-reviewed thresholds to simplify initial alert tuning for on-boarding.
- Alert Priority – Update all alert priority levels for existing alerts and expose for user customization.
- Priority Alert Response Action – New condition option to create alert response actions based on priority.
- Cloud/DBaaS Alert Template – New alert template specific to applicable alerts with some new alerts
- Alert Template Reports – Report on alert templates used by each instance and which alerts have been updated from default settings.
- Baseline Alerts – Separate alerts as a percentage of calculated baselines
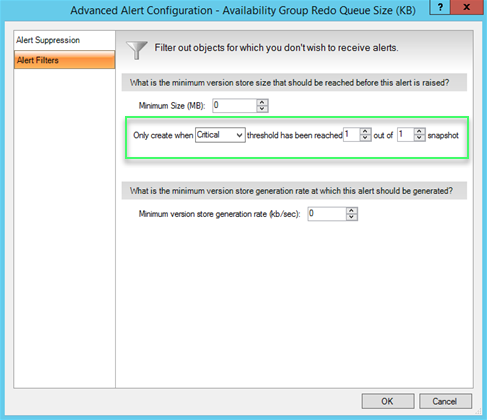
- Improved Filtering – Added filter option to reduce false positives and permit adjustment of default setting and setting by alert. Filter by percentage of time over a period exceeding threshold.
Prescriptive Analysis Improvements
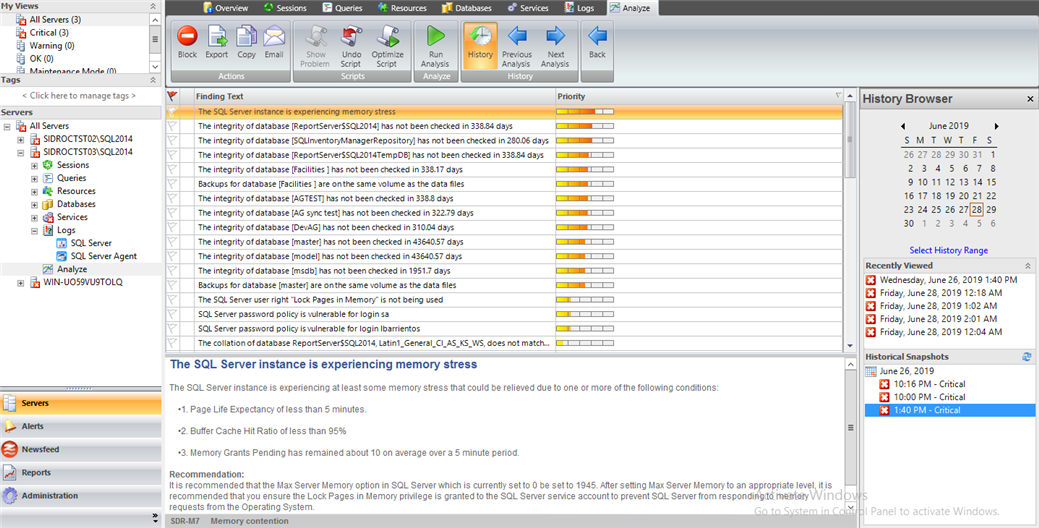
Prescriptive Analysis is more intuitive for on-demand analysis and integrated with the History Browser for further investigation. This version includes recommendations for DBaaS instances.
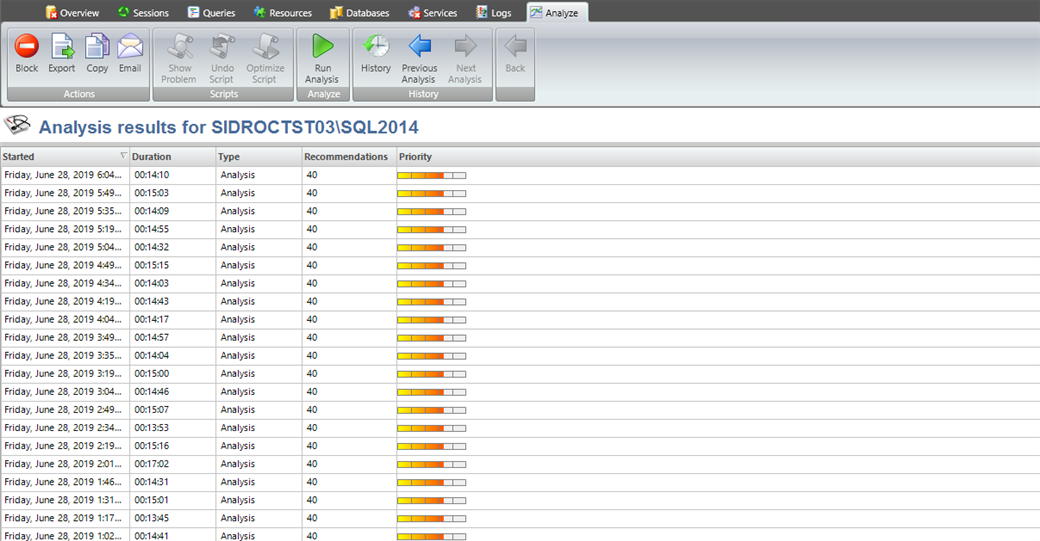
The Analyze tab in the Desktop console lists all the Analysis results that were performed, and now has one single button to run the Analysis.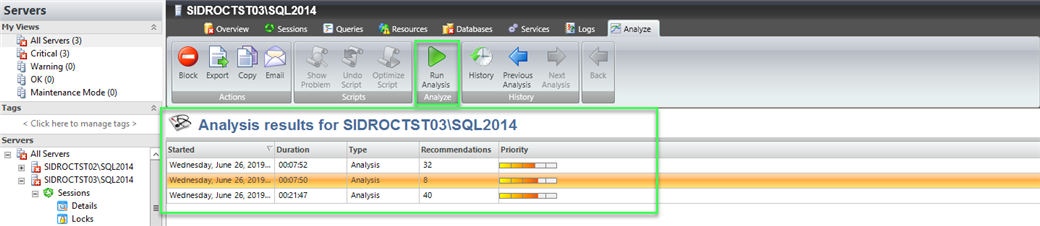
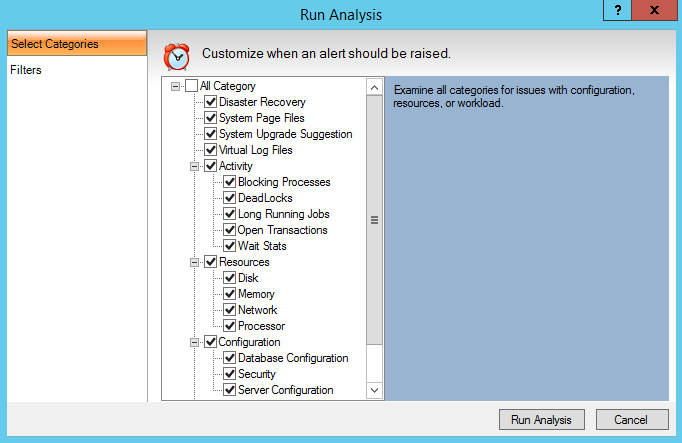
Follow these steps to run an Analysis for your monitored server:
- Click Run Analysis.
- Select the categories of analysis in every execution in the Run Analysis window (The list is divided in the following categories: Resources, Configuration, and Workload)

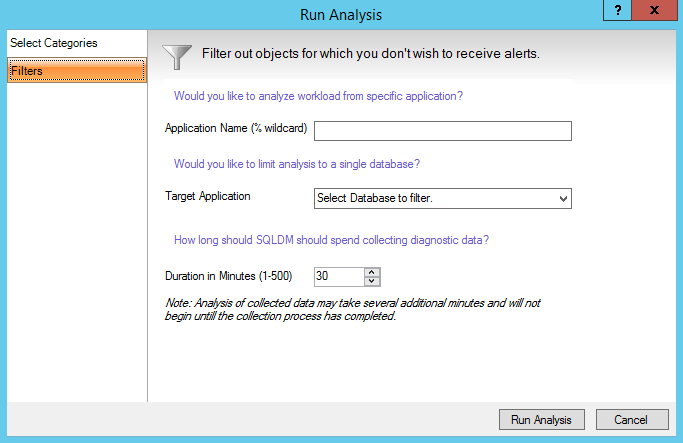
- In the Filter tab, you can isolate recommendations to specific targets and control overhead.

- Once you are done with the configuration of the Analysis, click Run Analysis.
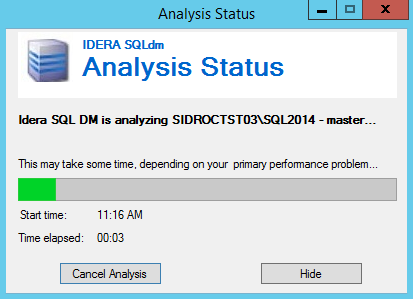
- The Analysis Status window prompts and allows you to check the status of your analysis, Cancel, or Hide it.

- Once your Analysis has completed, you can find it under the Analysis Results.

- Double-click your most recent or an older Analysis in the displayed list. Also, use the History Browser and navigate to the closest snapshot to the selected analysis.

![]()
Cloud DBaaS User Interface improvements
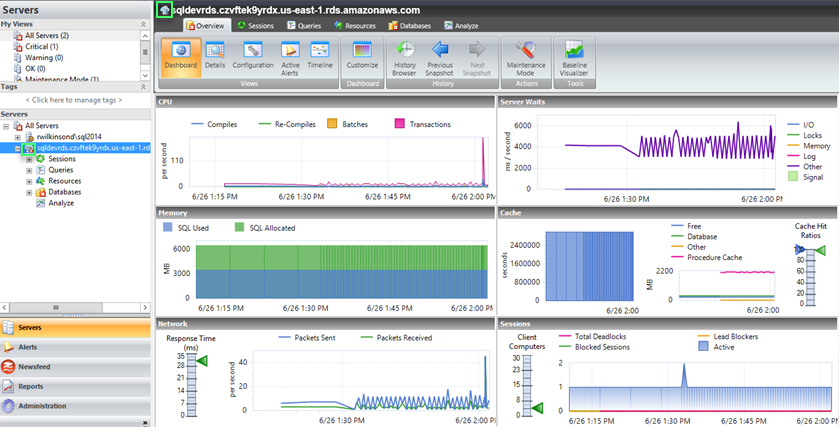
SQL Diagnostic Manager more efficiently monitors your DBaaS databases.
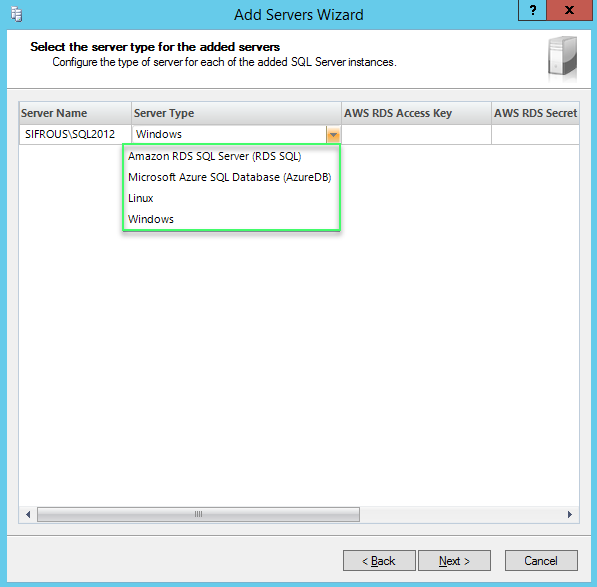
When adding cloud servers, select the Server Type for each of the added instances.
In the Desktop Console, you see only supported screens and panels displayed for Azure SQL and Amazon RDS. Also, the Custom Dashboard design screen has been revised to remove metrics that are not applicable for DBaaS.
![]()
Alerting Improvements
The primary objectives of DM 10.5 are to reduce false positives from spikes, simplify management of Alert Templates for enterprise deployments, and extend alerts for DBaaS environments.
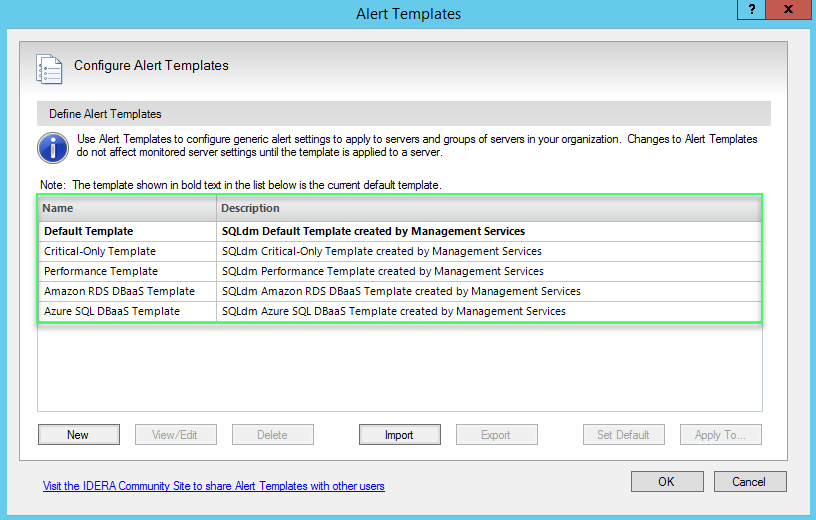
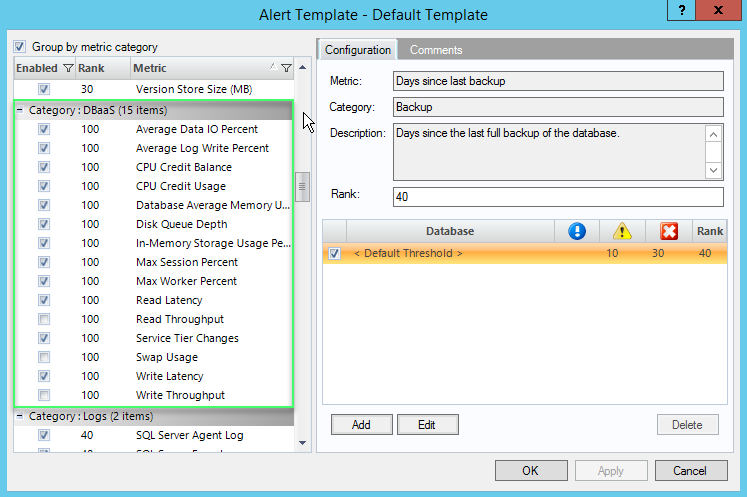
- Alert Templates –
- This release includes new alerts templates with revised thresholds and priority/rank for DBaaS (two specific alert templates for Azure SQL and Amazon RDS). These default templates help you to reduce time tuning and creating a custom one. DM 10.5 also exposes user-defined alert rank/priority for better directing alert responses.

- The alert priority settings have been thoroughly reviewed and revised to best practice settings by industry certified consultants.

- This release includes new alerts templates with revised thresholds and priority/rank for DBaaS (two specific alert templates for Azure SQL and Amazon RDS). These default templates help you to reduce time tuning and creating a custom one. DM 10.5 also exposes user-defined alert rank/priority for better directing alert responses.
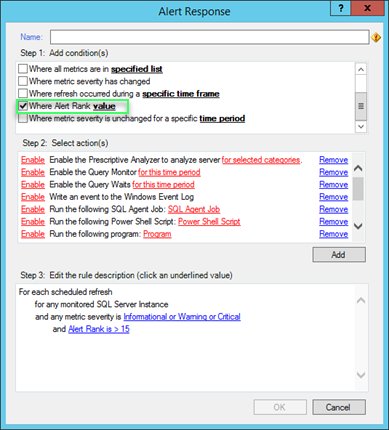
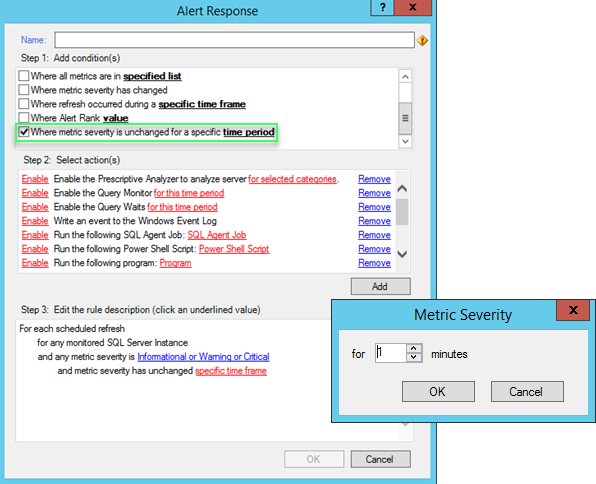
- Alert Response Actions –This release includes two new alert response conditions:
- Alert Rank – New Alert Response condition has been added, create rules based on priority and severity, and escalate alerts grouped by rank.

- Unchanged severity for a specific time period – Separate alert rules when alert severity is not addressed within a user-defined period. Allows you to escalate stagnant alerts and raise awareness.

- Alert Rank – New Alert Response condition has been added, create rules based on priority and severity, and escalate alerts grouped by rank.
- Filter out spikes – Users can increase collection intervals, helping reducing false positives from spikes.

- Baseline Alerts – Use default or scheduled baselines and detect any anomaly.
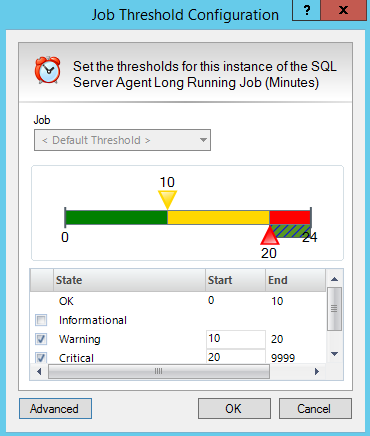
- Job Alerts – Add thresholds per job as needed, add a default alert for all jobs, filter irrelevant jobs, and reduce false positives from spikes.

- DBaaS Alerts – This release includes fifteen new DBaaS alerts for Azure SQL and Amazon RDS.

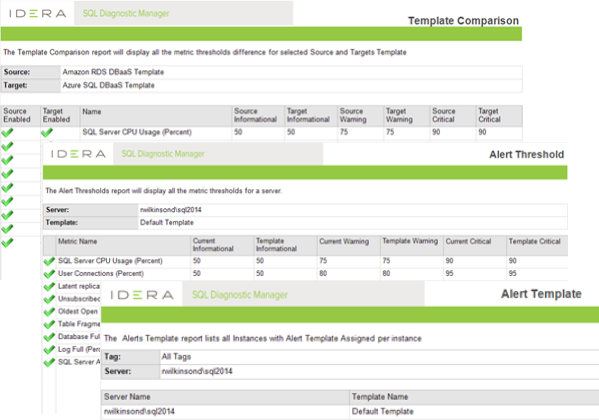
- Alert Reports – Three new reports are included in this release:
- Template Comparison – This report displays all the metric thresholds difference for the selected templates.
- Alert Template Report – This report displays all the server metric thresholds in comparison to the last assigned template.
- Alert Threshold Report – This report lists all the Alert Templates per instance.

Please feel free to give these new features a try and give us your feedback.
Questions or comments? Please let us know in the SQL Diagnostic Manager forum.