Despite your very best efforts, as tables increase in size and more and more users come online, sluggish MySQL performance eventually rears its ugly head. When that happens, you may be tempted to shrug it off as part of doing business. Don’t. By understanding the mechanisms behind database slowdowns and by methodically attacking the problem, you can home in on the culprit(s) and remedy the issues in a timely manner, before your business suffers substantial losses as a result.
The purpose of this blog is to assist you in determining the cause(s) of MySQL database performance issues using a couple of built-in tools.
Why Database Performance Slows Down
It’s no secret that database performance tends to degrade over time. While it’s easy to point the finger at the number of concurrent users, table scans, and growing tables, the reality is more complex than that. The most common reason for slow database performance is based on this "equation":
(number of users) x (size of database) x (number of tables/views) x (number of rows in each table/view) x (frequency of updates) x (processor) x (network latency)
While the above equation does not include every possible factor, it does address the most common ones.
The Importance of Following a Monitoring Plan
Although this paper is on MySQL troubleshooting, all of the preventative database best practices also apply to MySQL. Hence, the best defense remains a good offense. Regarding MySQL database management, that means regularly monitoring your database’s performance via key metrics. A sound database monitoring plan can help you stay on top of:
- Performance: By tracking performance-related metrics like query completion times you could spot any underperformers and come up with possible fixes.
- Growth: Observe changes in terms of users and traffic. Database usage needs can evolve very quickly and lead to gridlock.
- Security: Ensure that adequate security measures are applied.
Although following the above advice won’t eliminate performance issues, it may provide a better heads-up to issues as they develop.
Some Root Causes of Performance Issues
Getting to the root of database performance issues is a lot easier when you know what to look for. Over the years, many of the most common issues that plague relational database systems have been well documented for posterity. It turns out that the most common reasons for slow database performance are related to one or more issues in four broad areas:
-
Hardware/OS/Network-related causes:
- Limited amount of available disk space and/or memory on the server or clients’ machines.
- Out of date/obsolete Network Interface Cards (NIC) or other server/client hardware.
- Inappropriate OS (operating system) for running server or client applications.
- All sorts of malware.
- Network issues, excessive network traffic, network bottlenecks, or database traffic.
-
Native and 3rd party application interference:
- Scheduled jobs – backup, maintenance, AV-scan, application and system updates.
- Other applications and (3rd party) software installed on the machine. Remember that all programs launched at startup are always running in the background.
-
Database Design:
- Large number of views in a database with queries using expensive subqueries and poor indexing of tables can use extensive memory and cause swapping.
- Some database properties can slow performance while others improve performance. Be careful when choosing character sets and datatypes in particular.
- Configuration of server and application framework does not allow access to all system resources or require more resources than available. Both will reduce performance.
- Make sure that there are no database admin utilities such as backup, synchronization, or compression are running during peak hours.
- Large attachments (BLOBS) in databases.
- Inefficient coding/programming of custom applications. Often it will be possible have application logic in the application or in Stored Procedures, Triggers etc. Choose the right approach for the task. Database corruption and fragmentation (could also be paired with other symptoms including incorrect results from some queries). Consider to run some check/repair/defragmentation routine periodically.
Database-related Performance Issues
It can be surprising how many database issues stem from within the database itself. From over normalization of tables to improper indexing, to poorly constructed queries, there are many flaws that are only exposed once a certain usage threshold has been reached.
Luckily, MySQL comes equipped with a couple of excellent tools to help get at the root cause of slow MySQL performance, namely the Slow Log and Performance Schema.
The MySQL Slow Query Log
The most common internal cause of database slowdowns are queries that monopolise system resources. Factors that contribute to poor query performance include inadequate indexing, fetching a data set that is very large, complex joins, and text matching.
The slow query log is meant to identify queries that would make good candidates for optimization. It consists of SQL statements that took more than a certain number of seconds to execute.
The default value of ten seconds is stored in the long_query_time system variable. You can check its value by selecting it (note the two ‘@’ characters):
mysql> select @@long_query_time

+-------------------+

| @@long_query_time |

+-------------------+

|         10.000000 |

+-------------------+
Ten seconds is probably too long as a cut-off for most production settings. To change it, use the SET statement:
mysql> SET @@long_query_time = 5
You can also log queries that require MySQL to examine more than a certain number of rows to the slow query log. That value is defined in the min_examined_row_limit system variable. It only includes the time to resolve the query and not the time to acquire locks. If you haven’t changed it, it will contain a value of zero:
mysql> select @@ min_examined_row_limit;

+--------------------------+

| @@ min_examined_row_limit |

+--------------------------+

|         0                |

+--------------------------+
To modify it, use the SET statement. It can contain any Integer between 0 and 4294967295 on 32-bit platforms and 18446744073709551615 on 64-bit platforms:
mysql> SET @@min_examined_row_limit = 500000;
It is important to note that the slow query log is disabled by default. This is because logging can place a bit of a drag on performance. Therefore, it’s best to enable the Slow Query log (preferably from MySQL configuration file) for a short period of time, e.g. 2-3 days, when your application performance is reduced for some reason and you wish to detect the slow queries.
You can check if the MySQL slow query log is enabled using the following statement:
SHOW VARIABLES Like 'slow_query_log%';

Variable_name Value
---------------------------------
slow_query_log OFF

slow_query_log_file   C:\Program Files\MySQL\MySQL Server 5.6\data\LH12CU19884-slow.log
Follow these steps to enable the Slow Query Log:
- Shut down any applications that are using MySQL.
- Shut down MySQL itself.
- Add the following configuration options to my.ini or my.cnf (see “Appendix 1: Where is the MySQL Configuration file located?” section for more information):
# What's the threshold for a slow query to be logged?

long_query_time=0.5


# Where should the queries be logged to?

slow_query_log_file=/path/to/logfile


# Enable slow query logging - note the dashes rather than underscores:

slow-query-log=1
- Save the file, and restart MySQL.
- Restart your connected applications.
A professional MySQL monitoring tool should also provide access to the Slow Query Log and its parameters:
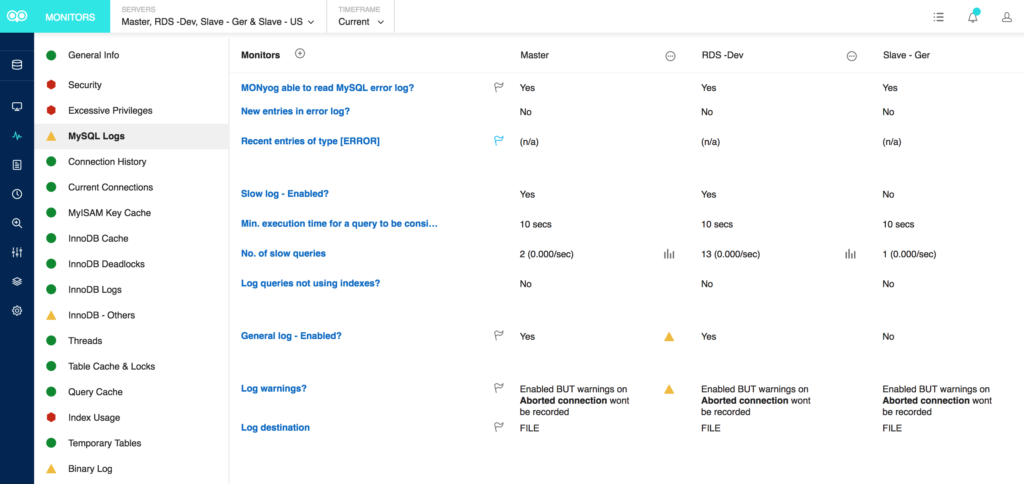
MySQL logging information in Monyog
Viewing the Slow Query Log
MySQL provides a tool called mysqldumpslow which can be used to analyze the log file.
The following syntax will show you the top 10 queries sorted by average query time (Remember to update the file names and paths to suit your environment):
mysqldumpslow -t 10 mysql-slow-query.log > mysqldumpslow.out
Here is some sample output:
Reading mysql slow query log from /usr/local/mysql/data/mysqld51-apple-slow.log

Count: 90  Time=56.73s (6183s) Lock=0.00s (0s)  Rows=0.0 (0), root[root]@localhost

select * from t1
The important values to look at here are the Count and the Time. The Count is the number of times this query ran within your log set. The Time is an average amount of time for each of those queries runs to complete. With the number in parentheses, in this case 6183s, being the total (Count x Time) amount of time spent on running this query.
GUI tools like Monyog can greatly simplify analyzing the MySQL Slow Query Log by showing detailed reports:
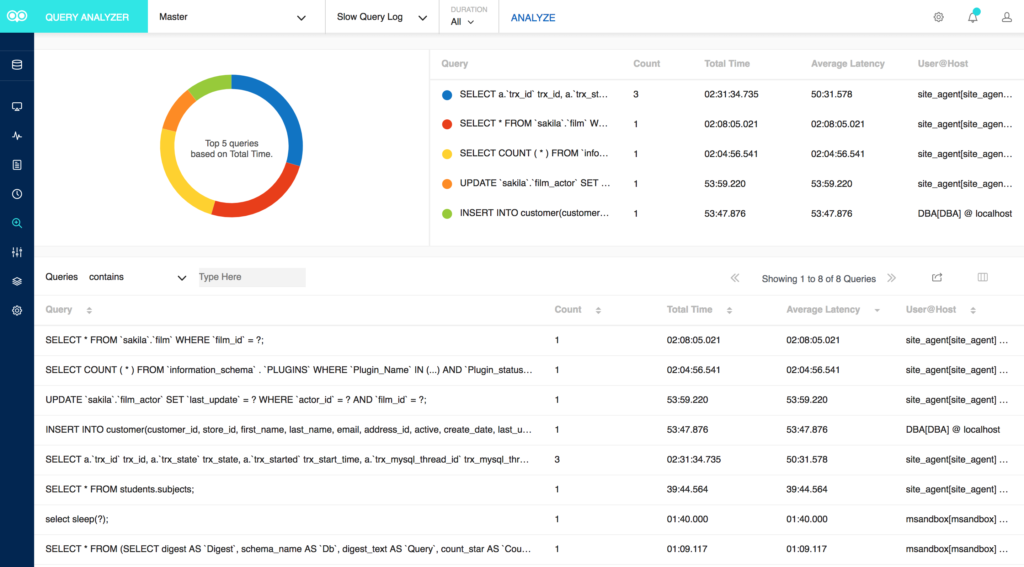
Analysis of MySQL Slow Query Log in Monyog
The Performance Schema
The MySQL Performance Schema is a feature for monitoring MySQL Server execution at a low level. It provides details about server execution in structured way that is accessible via regular SQL. Moreover, the PERFORMANCE_SCHEMA is a storage Engine that is only used for special tables in the performance_schema database. That database contains 52 tables and no views, comprising of a mix of tables that encompass the following categories:
- Configuration Tables
- Object Tables
- Current Tables
- History Tables
- Summary Tables
- Other Tables
The PERFORMANCE_SCHEMA can be utilized to troubleshoot:
- Server bottlenecks, caused by locks, mutexes, IO
- Less-than optimal statements
- Most expensive operations
- Connection issues
- Memory usage
- Replication failures
- More…
Configuration
Starting from MySQL 5.6.6 the Performance Schema is enabled by default. It contains instruments, which are the things you can measure, and consumers which are those that use the measurements. Not all instruments and consumers are enabled out of the box, so to ensure we have everything enabled, a few options have been added to the MySQL configuration file. See the MySQL docs for more information on configuring the Performance Schema.
Long-running Processes
The Performance Schema keeps track of events that take time as instruments waits.
These tables store wait events:
- events_waits_current: Current wait events
- events_waits_history: The most recent wait events per thread
- events_waits_history_long: The most recent wait events globally (across all threads)
Once the performance schema is enabled, it will collect metrics on all the statements executed by the server. Many of those metrics are summarized in the events_statements_summary_by_digest table, available in MySQL 5.6 and later.
Metrics on query volume, latency, errors, time spent waiting for locks, index usage, and more are available for each normalized SQL statement executed. (Normalization here means stripping data values from the SQL statement and standardizing whitespace.)
This query finds the top 10 statements by longest average run time:
SELECT substr(digest_text, 1, 50) AS digest_text_start

     , count_star

     , avg_timer_wait

  FROM performance_schema.events_statements_summary_by_digest

 ORDER BY avg_timer_wait DESC

LIMIT 10;

digest_text_start  count_star avg_timer_wait
-------------------------------------------------------------------------------------

SHOW FULL TABLES FROM `sakila` 				1		1110825767786

SHOW GLOBAL STATUS LIKE ? 				1		1038069287388

SELECT `digest_text`, `count_star`, `avg_timer_w	1		945742257586

SHOW FIELDS FROM `sakila` . `actor` 			1		611721261340

SELECT `digest_text` , `count_star` , `avg_timer_w	2		335116484794

SHOW FIELDS FROM `sakila` . `actor_info` SELECT `a	1		221773712160

SELECT NAME , TYPE FROM `mysql` . `proc` WHERE `Db	2		148939688506

SHOW FIELDS FROM `vehicles` . `vehiclemodelyear` 	1		144172298718

SHOW SCHEMAS 						2		132611131408

SHOW FIELDS FROM `sakila` . `customer` 			1		99954017212
Event Timer Units
Performance Schema displays event timer information in picoseconds (trillionths of a second) to normalize timing data to a standard unit. In the following example, TIMER_WAIT values are divided by 1000000000000 to show data in units of seconds. Values are also truncated to 6 decimal places.
digest_text_start  count_star avg_timer_wait
----------------------------------------------------------------------------------------


SHOW FULL TABLES FROM `sakila` 				        1		1.110825

SHOW GLOBAL STATUS LIKE ? 					1		1.038069

SELECT `digest_text`, `count_star`, `avg_timer_w		1		0.945742

etc.
Unused Indexes
The table_io_waits_summary_by_index_usage table may be employed, not only to aggregate operations per index, but also to aggregate how many operations did not use indexes when accessing the tables. This may be accomplished by including the “INDEX_NAME column is NULL” criteria in the WHERE clause. Here’s a query that produces a result set of two rows where one table’s index is being used and another’s is not:
SELECT object_schema AS schema_name,

       object_name   AS table_name,

       index_name,

       count_fetch

FROM performance_schema.table_io_waits_summary_by_index_usage

WHERE count_fetch > 0;

schema_name     table_name  	index_name				count_fetch
-----------------------------------------------------------------------------------
vehicles	vehiclemodelyear    U_VehicleModelYear_year_make_model	    7273

sakila	film		   (null)				   1001
Long-running Queries
Being one of the most common causes of slow database performance, long-running queries should be at the top of your list of suspects whenever slowdowns occur.
The events_statements_history_long table contains a lot of indicative fields on the subject of wait times and their corresponding statements. The following query compiles some useful calculations on wait times to provide a clear picture of which statements are taking the longest to execute:
SELECT left(digest_text, 64) AS digest_text_start

     , ROUND(SUM(timer_end-timer_start)/1000000000, 1) AS tot_exec_ms

     , ROUND(SUM(timer_end-timer_start)/1000000000/COUNT(*), 1) AS avg_exec_ms

     , ROUND(MAX(timer_end-timer_start)/1000000000, 1) AS max_exec_ms

     , ROUND(SUM(timer_wait)/1000000000, 1) AS tot_wait_ms

     , ROUND(SUM(timer_wait)/1000000000/COUNT(*), 1) AS avg_wait_ms

     , ROUND(MAX(timer_wait)/1000000000, 1) AS max_wait_ms

     , ROUND(SUM(lock_time)/1000000000, 1) AS tot_lock_ms

     , ROUND(SUM(lock_time)/1000000000/COUNT(*), 1) AS avglock_ms

     , ROUND(MAX(lock_time)/1000000000, 1) AS max_lock_ms

     , COUNT(*) as count

 FROM events_statements_history_long

  JOIN information_schema.global_status AS isgs

 WHERE isgs.variable_name = 'UPTIME'

 GROUP BY LEFT(digest_text,64)

 ORDER BY tot_exec_ms DESC;

digest_text_start                  avg_exec_ms    tot_wait_ms     max_wait_ms    avglock_ms      count

                            tot_exec_ms     max_exec_ms     avg_wait_ms     tot_lock_ms     max_lock_ms

---------------------------------------------------------------------------------------------------------

SELECT * FROM `sakila` . `rent	240.3	240.3	240.3	240.3	240.3	240.3	0.0	0.0	0.0	1

SELECT * FROM `sakila` . `film	56.6	56.6	56.6	56.6	56.6	56.6	0.0	0.0	0.0	1

UPDATE `performance_schema` . 	49.8	49.8	49.8	49.8	49.8	49.8	42.0	42.0	42.0	1

SELECT `st` . * FROM `performa	12.7	2.1	11.9	12.7	2.1	11.9	13.0	2.2	12.0	6

SELECT `st` . * FROM `performa	2.6	0.4	0.5	2.6	0.4	0.5	2.0	0.3	1.0	6

SELECT `st` . * FROM `performa	0.8	0.1	0.2	0.8	0.1	0.2	0.0	0.0	0.0	6

SHOW INDEX FROM `sakila` . `fi	0.8	0.8	0.8	0.8	0.8	0.8	0.0	0.0	0.0	1

SHOW INDEX FROM `sakila` . `re	0.6	0.6	0.6	0.6	0.6	0.6	0.0	0.0	0.0	1
Here’s a way to find a long-running query using the threads table:
SELECT PROCESSLIST_ID AS id,

        PROCESSLIST_USER AS user,

        PROCESSLIST_HOST AS host,

        PROCESSLIST_DB AS db,

        PROCESSLIST_COMMAND AS command,

        PROCESSLIST_TIME AS time,

        PROCESSLIST_STATE AS state,

        LEFT(PROCESSLIST_INFO, 80) AS info

 FROM performance_schema.threads

 WHERE PROCESSLIST_ID IS NOT NULL

 AND PROCESSLIST_COMMAND NOT IN ('Sleep', 'Binlog Dump')

 ORDER BY PROCESSLIST_TIME ASC;

Id  user  host	     db		         command  time  state		info

------------------------------------------------------------------------------------------------------------------

2   root  localhost  sakila	Query	   0	   Creating sort index	SELECT PROCESSLIST_ID AS id,PROCESSLIST_USER…
Memory Usage
Want to quickly ascertain how much RAM does a server have? Available since version 5.7, the sys tables provide detailed information about memory usage of each server’s allocated internal memory:
SELECT * FROM sys.memory_global_total;

total_allocated

---------------

458.44 MiB
This final example fetches memory utilization by thread:
SELECT thread_id,

       user,

       current_avg_alloc,

       current_allocated

FROM sys.memory_by_thread_by_current_bytes

WHERE thread_id IN (145, 146)\G

********************** 1. row **********************

thread_id: 145

user: sql/slave_io

current_allocated: 1.04 GiB

current_avg_alloc: 2.64 KiB

********************** 2. row **********************

thread_id: 146

user: sql/slave_sql

current_allocated: 1.79 MiB

current_avg_alloc: 72 bytes

2 rows in set (0.11 sec)
Conclusion
Troubleshooting MySQL database issues can help in reducing slowdowns and downtime. In this aspect, Slow Query Log and Performance Schema can be a major contributor in identifying key performance issues.
In this blog, we demonstrated how slow query log is meant to identify queries that would make good candidates for optimization and how Performance Schema keeps track of long-running processes, unused indexes, memory usage, and other metrics can be helpful in troubleshooting sluggish MySQL performance.
As tables increase in size and more and more users come online, sluggish database performance is bound to happen sooner or later. By understanding the mechanisms behind MySQL slowdowns and by employing MySQL’s built-in tools, you can home in on the culprit(s) and remedy the issues in a timely manner.
Appendix 1: Where is the MySQL Configuration file located?
The location of the MySQL configuration file (either my.ini or my.cnf) depends on your OS.
MySQL will look at each location in order, and use the first file that it finds. Often, if the file does not exist, it must be created first.
Linux based MySQL systems will use configuration files in the following order of precedence
- /etc/my.cnf
- /etc/mysql/my.cnf
- SYSCONFDIR/my.cnf
- $MYSQL_HOME/my.cnf
SYSCONFDIR refers to the directory specified when MySQL was built; typically reverse to the etc directory located under the compiled-in installation directory.
MYSQL_HOME is an environment variable referring to the path where my.cnf can be found.
Windows-based MySQL systems will use the configuration files in the following order of precedence
- %PROGRAMDATA%\MySQL\<MySQL Server Version>\my.ini
- %PROGRAMDATA%\MySQL\<MySQL Server Version>\my.cnf
- %WINDIR%\my.ini
- %WINDIR%\my.cnf
- C:\my.ini
- C:\my.cnf
- INSTALLDIR\my.ini
- INSTALLDIR\my.cnf
Monyog is a MySQL monitoring tool that improves the database performance of your MySQL powered systems. Download your free trial.